Content:
Article: astronomy related #1
A two component model of the interstellar absorption
To properly print this text, please download the file. You can easily do so using the Download button at the top right ↗️
Thank you for your interest!
Article: astronomy related #1
A two component model of the interstellar absorption
D. Malaise
F. Beeckmans
C. Jamar
Institut d'Astrophysique, Université de Liège
© Societa Astronomica Italiana · Provided by the NASA Astrophysics Data System
The S2/68 sky survey telescope on board the TD1A satellite provides us with a large number of absolutely calibrated spectra of early type stars between 1350 and 2550Å. (For the description of this experiment, see BOKSENBERG et al., 1973). More than 200 stars of type 0 to B6, for which the data are of good quality, have been examined.
In a previous study of smaller sample of these spectra (MALAISE et al., 1974), the large dispersion of the flux at 2100Å relative to the (B-V) index was tentatively attributed to interstellar reddening. The present statistical study is an attempt to get a clearer picture of the situation.
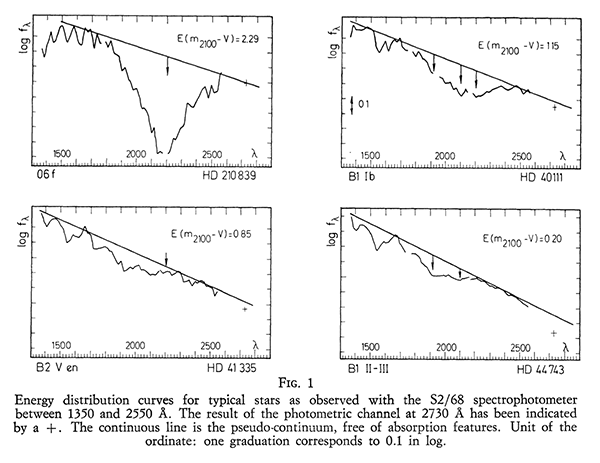
Figure 1 shows various typical early type spectra with different stellar and interstellar absorption features. The first spectrum shows a huge interstellar absorption at 2200Å; the second one is a star with a large color excess but without a broad purely stellar absorption peaking at 1940 and 2070Å (mainly due to strong blanketing by FeIII). Last, we have a spectrum showing a mixture of a strong stellar absorption around 1940 and 2070Å and a small interstellar absorption at 2200Å.
The (m 2100 -V) index is defined in order to characterize the relative intensity of the Balmer and the Paschen continua, free of the strong stellar or interstellar absorption features, but not free of reddening. Hence, the flux at 2100Å is measured on a line bridging the absorption features described previously and touching the actual spectra in two regions relatively free of absorption.
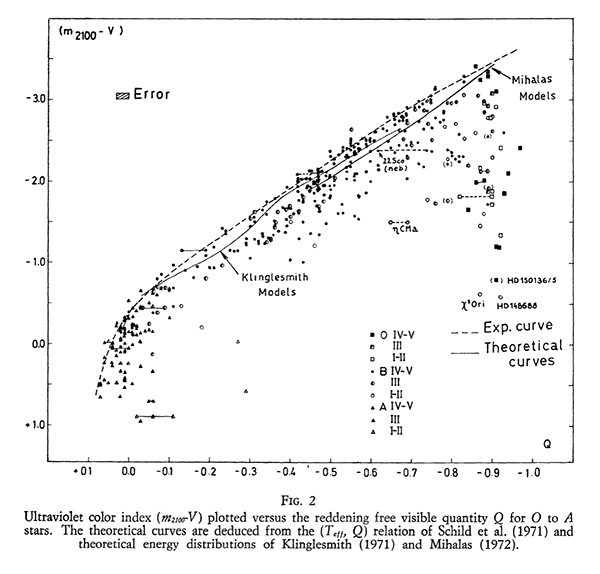
In figure 2 the index (m 2100 -V) is plotted versus the reddening free quantity Q = (U-B) - S(B-V) where S is taken from HEINTZE (1973). The scatter is rather large and grows towards the early type stars where it is greater than 2 magnitudes. Here is introduced the hypothesis that this scatter is entirely due to reddening and one defines the color excess E(m 2100 -V) as the ordinate difference between each star and the upper envelope drawn in dashes on the figure. As a comparison, we have drawn on the same figure the lines representing the different models.
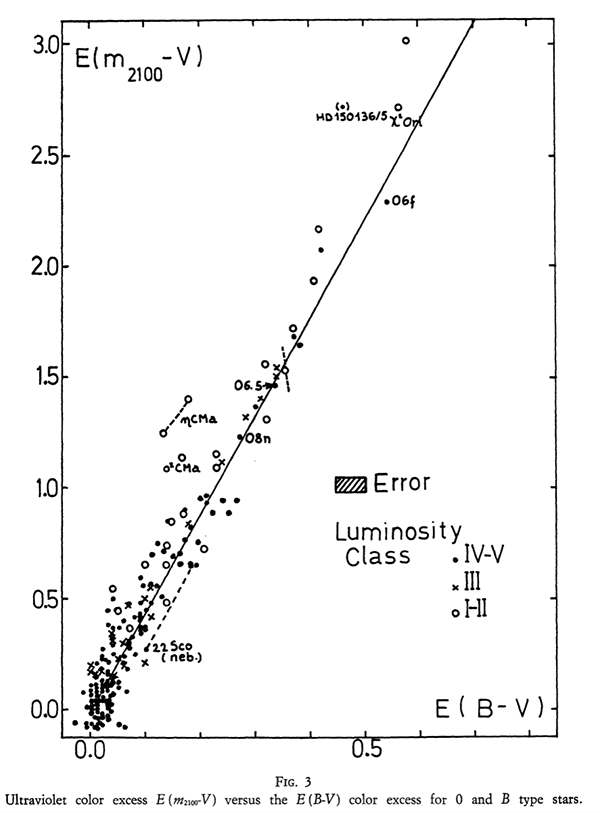
The next figure (figure 3) shows the correlation between our empirical color excess E(m 2100 -V) and the usual color excess E(B-V). If we assume that for non-reddened stars, both excesses have to come to zero, this curve justifies our choice of the envelope curve in figure 2 as representing the intrinsic relation between Q and (m 2100 -V) versus E(B-V) plot would show a much larger scatter and the mean curve would go through a point situated at E(B-V) = 0, E(m 2100 -V) = - 0.2. The excellent correlation obtained whatever is the spectral type, the luminosity and the 2200Å absorption shows also that our way of tracing the pseudo-continuum has effectively separated the reddening from the absorption feature at 2200Å. Note in particular the good agreement between the scatter around the mean curve and the experimental error on individual stars.
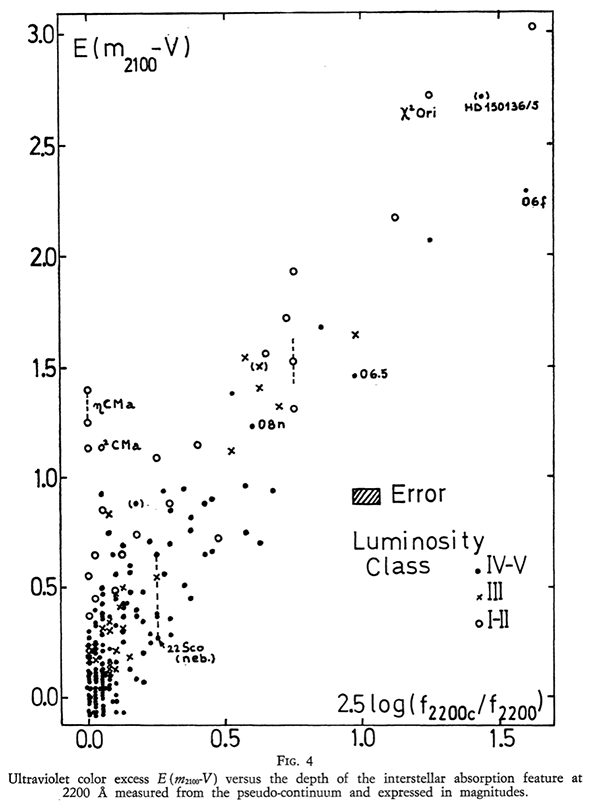
In figure 4 one has plotted the color excess E(m 2100 -V) versus the depth of the interstellar absorption feature at 2200Å measured from the pseudo-continuum. The graph shows a strong correlation between the two quantities. But, if the scatter of the points is compared with the error rectangle, one must admit that there is a certain amount of decorrelation as well. If we examine the behaviour of the points near the origin we may tentatively admit that the decorrelation applies only to the ordinate, i. e. to the reddening. As a matter of fact, it can be seen that there are many stars which show no or little absorption at 2200Å although they are reddened. If one admits that the physical cause of this decorrelation is the same for all the stars, the conclusion drawn about those stars which are around the origin can be extended to the whole graph and the following interpretation can be given.
There is a superposition of two components: compenent A gives rise to an absorption which contains a fixed ratio of reddening and of absorption at 2200Å. Component B gives rise to a pure reddening with no absorption at 2200Å. This reddening varies from star to star between 0 and 1 magnitude. In the grah, component A alone would give a lower envelope to the points. (For instance a line drawn through the origin, the 06.5 and the 06f stars).
It is possible to relate the two components which show up in the statistical analysis of figure 4 with a two component hypothesis for the interstellar medium. Component A could be related to the general interstellar medium, while component B could be related to an absorbing medium localised closer to the individual stars. This latter medium does not contain the particules responsible for the 2200Å feature. It could be localised directly around the star (circumstellar) or in a broader region containing several stars.
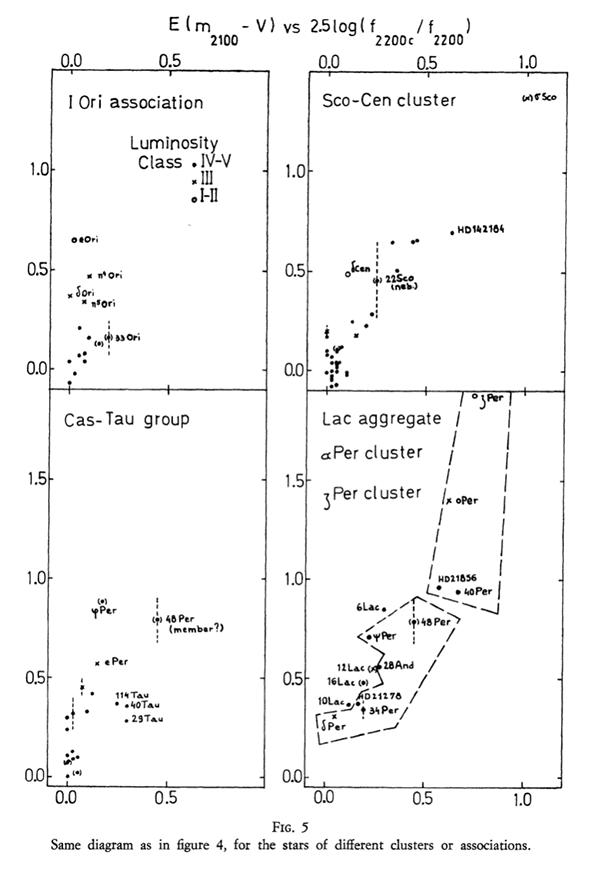
One has examined the behaviour of stars of different associations. Figure 5 shows the correlation graph identical to the one of figure 4 for different groups of stars. Although these data are too scarse to make a good statistical study, it seems that two main behaviours are present. Some clusters lay rather well along the curve due to component A (Sco-Cen, α Per) while others lay more or less along vertical lines starting from different points of the component A line (I Ori, ζ Per). If this latter case could be confirmed, it would give arguments to identify component B with the medium surrounding the stars of the association. On the other hand, the general graph (figure 4) shows that the pure reddening component is correlated with the luminosity of the stars, which favours the circumstellar hypothesis.
The implications of this analysis have to be studied further. This paper simply aimed at showing the results and the pecularities of a statistical analysis of the S2/68 data.
References
A. Boksenberg, R. G. Evans, R. G. Fowler, I. S. K. Gardner, L. Houziaux, C. M. Humphries, C. Jamar, D. Macau, J. P. Maca, D. Malaise, A. Monfils, K. Nandy, G. I. Thompson, R. Wilson and H. Wroe, 1973, Mon. Not. R. Astr. Soc. 163, 291.
J. R. W. Heintze, 1973 IAU Symposium 54, Gevena 1972, "Problems of calibration of absolute magnitudes and temperature of stars." Ed. Hauck B. and Westerlund B. E., p 231.
D. A. Klinglesmith, 1971, NASA-SP-3065.
D. Malaise, M. Gros, D. Macau, 1974, Astron. and Astrophys., 33, 79.
D. Mihalas, 1972, NCAR Technical Notes, NCAR-TN-STR 76.
R. E. Schild, D. M. Peterson, J. B. Oke, 1971, Astrophys. J., 166, 95.
D. Malaise
F. Beeckmans
C. Jamar
Institut d'Astrophysique, Université de Liège
© Societa Astronomica Italiana · Provided by the NASA Astrophysics Data System