Content:
Application note #5
Telescope mirror coating maintenance with CT7
To properly print this text, please download the file. You can easily do so using the Download button at the top right ↗️
Thank you for your interest!
Application note #5
Telescope mirror coating maintenance with CT7
Copyright:
Author:
Daniel Malaise, Dr Sc
First issue: October 2009
Last review: August 2020
This document is the sole property of OPO and, except to learn about our work, may not be used without our written consent.
Introduction
After an astronomical telescope has been commissioned, its optical performance is mostly dependent on the quality and cleanliness of the reflective coating. Since the latter is necessarily exposed to weather conditions, it will degrade with time.Regularly, the coating is removed and a fresh one is evaporated on the mirror. This is a major operation since it requires removing the mirror from the telescope, transferring it to the aluminizing facility, removing the old coating, cleaning thoroughly the surface and evaporating the new coating.
It is quite usual to perform dry flush cleanings between two aluminizations. These are much simpler operations that allow recovering part of the fresh coating quality and increasing the life time of each coating.
It is however necessary to have a quantitative assessment of the quality of the coating at any time, in order to base the decision of cleaning or coating anew on rational grounds.
This is performed with two techniques of metrology: Reflectometry and Scatterometry .
The aim of this paper is to explain how these techniques work and how they should best be applied to the maintenance of telescope mirror’s coatings.
The good question to ask first is: what is the telescope mirror supposed to do ideally? Simple enough: it should bring all the flux entering the pupil (usually the primary mirror surface) into the airy circle at the focus.
Two deviations occur due to degradations of the coatings :
- Some part of the flux will fall outside the airy disk (or whatever resolution element which is considered) : this is due to scattering.
- The part of the flux that falls inside the resolution element is further dimmed by coating absorption: this is due to a lack of specular reflectivity.
Both deviations have a lower limit that do not depend on the quality of the coatings:
- Scattering is produced by the limited quality of the polish of the surface; this we shall call the basic mirror’s scattering. It is directly related to the glass microroughness.
- Metal Coatings do not reflect 100 % of the incident flux; usually they are chosen for their reflectivity in the wavelength range used; Aluminum is the mostly utilized because it is easy to handle and fairly atmospheric resistant and shows good reflectivity over 90% in a wide range except in an absorption band around 830 nm. Gold is excellent above 700 nm up to thermal IR; Ag is the best as far as reflectivity is concerned, but it is extremely sensitive to chemical degradation by sulphuric components and needs protecting layers.
Degradations due to exposure
Hence we start with the fresh coating and its basic defects: the fresh specular reflectivity ‘FSR’ value and the mirrors micro roughness ‘MMR’ that results in a mirror induced total integrated scattering ‘ MiTIS ’. Let us first assess orders of magnitude to these figures (µR is expressed in nm).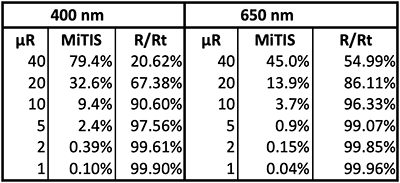
The table shows the MiTIS and the ratio of specular to total reflectivity for various values of the µ-roughness of the mirror as measured for two wavelengths 400 nm and 650 nm. One sees that a mirror should not be commissioned if its µroughness exceeds 2 or 3 nm (if it is intended for use in the visible range).
An excellent coating will not increase the MMR and can sometimes even reduce it, while a bad coating can increase the µroughness by building agglomerates of material that tend to grow faster than the neighborhood. This is particularly sensitive for very thick coatings. This defect can be detected just after aluminization shortly after opening the tank. This measurement with a scatterometer working at a short wavelength should be performed in a clean room environment. Otherwise, one will measure the scattering due to dust together with scattering due to µroughness, and the latter could not be assessed.
Note also that it is not possible to measure the µroughness of the uncoated mirror with a scatterometer because of the bulk scattering of the mirror’s substrate. One should then compare the measurements made after each coating in order to appreciate the quality of the present one. This is not a very satisfactory situation, but it allows noticing if something went wrong during the coating operation. Usually, when a mistake has taken place in the process (contamination, too high pressure during evaporation, coating too thick …) the TIS value will be way out of the normal value.
As soon as the mirror has been exposed for a few days, the µroughness is not anymore related to the measured TIS , the latter value being commanded by the dust pollution. Then the only relevant characteristic of the coating is its specular reflectivity at various wavelengths.
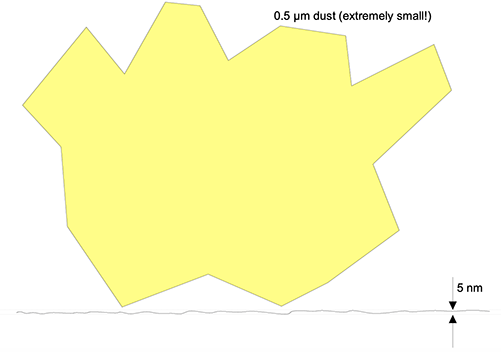
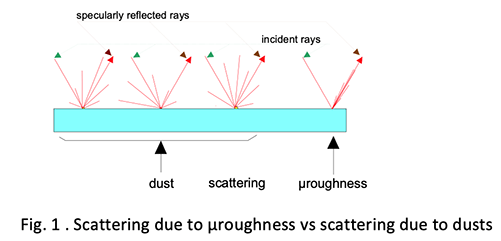
This point is illustrated in Fig.1. The lower part of the figure shows four incident rays on the mirror, the three to the left fall on microdust scattering light in various ways depending on the dust shape, position and nature ; the one to the right falls on a clean area of the mirror and is subject to scattering originating in the µroughness of the mirror. Dust scattering is a really stochastic process; the scattering angles obeys no law because the dust can have any shape and be positionned at any angle; it can be facetted (sand particle) or a filament or a micro piece of skin etc. The µroughness scattering on the contrary is uniquely determined by its average depth related to the wavelength; since it is about hundred times smaller than the wavelength, its exact shape is indifferent; that is why it can be described by simple laws and computed theoretically.
The upper part of the figure shows the µroughness of the mirror as compared to a micro-dust. This illustration is just there to get the correct feeling of the situation. Note that the µroughness shown is rather large while the dust is chosen very small compared to any real situation.
The scattering due to dust is usually harmless for astronomical observations because it spans over a wide angle and so the stray light tends to be diluted far away from the focused image. It becomes annoying only when its value is large enough to remove an unacceptable fraction of light, that is when it causes the specular reflectivity to drop under a tolerable value. The scattering due to µroughness is more harmful because the stray light is scattered much closer to the focused image.
Ray tracing and simulations
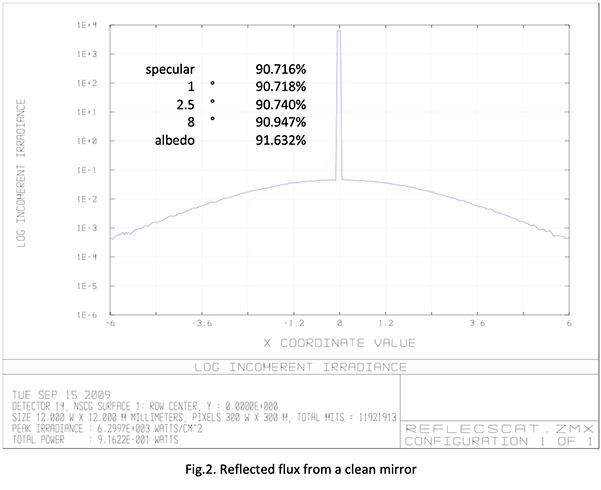
Clean Mirror with TIS=1%
Fig.2. illustrates the reflectivity of a very clean mirror showing 1% total scattering; the albedo is 91.63%; this is the figure, which would be measured with a total reflectance apparatus featuring an integrating sphere (Minolta CM508D, Surface Optics 410-Vis).The figure of reflectivity that is of concern for astronomers is the specular reflectivity ; that is the proportion of energy, which is comprised, in the central peak. Only this energy forms an image; the rest is scattered outside the resolving area and is lost for the image; this is shown on the figure by the dome shaped curve. Here, the rays are traced for a focal length of 10 mm and a detector of 12 mm diameter, thus covering semi aperture of 31°.
The reflectivity measured with various acceptance angles (1°; 2.5° and 8°) is shown; this is the ratio of the flux falling on a detector of 0.35 mm diameter (respectively 0.87 mm and 2.8 mm) to the input flux. One sees that for a very clean mirror, the acceptance angle does not influence the measured reflectivity as far as its stays within a few degrees. But even for such a perfectly clean mirror, measuring with a total reflectance apparatus will show an error amounting approximately to the TIS of the mirror (here 1%). The value shown by the total reflectometer is always too high, due to the fact that it includes unwanted scattered light.
Exposed mirror with TIS=5%
Fig.3. illustrates the reflectivity diagram of a moderately exposed mirror with the same coating but 5% scattering. The albedo is the same as in the preceding case and is close to what would be measured as total reflectivity. Here one can see more clearly the influence of the acceptance angle of the apparatus used to measure the specular reflectivity .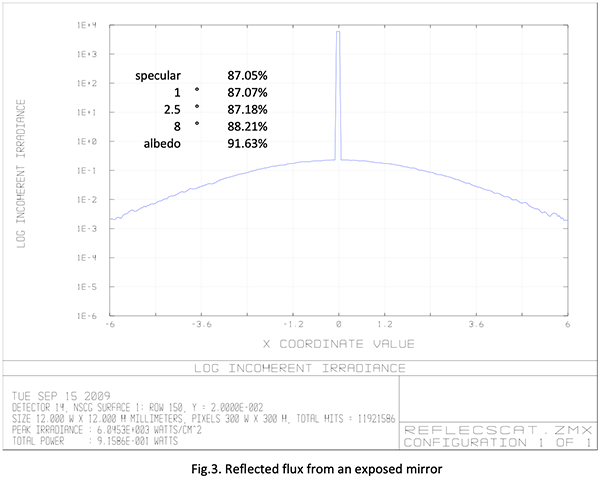
For high accuracy work, for instance if one wants to monitor the degradation of the coating with time, one should not build in the measurement chain single errors that amount to more than 10% of the required total accuracy, i.e. the single error due to the acceptance field should not exceed .1%. This calls for an acceptance angle smaller than 2°.
With 5% scattering, the value found with a “total reflectometer” is way out (4.6%) from the correct specular value. For a dirty mirror showing 12% scattering, the situation is still worse and correct measurement of the specular reflectivity requires an acceptance field limited to 1°. The more the coating ages and accumulates dust, the more sensitive the measurement is on the value of the acceptance angle. To those who do not grasp the importance of this point, I would suggest the following experiment: procure a bare aluminum flat mirror; measure its total reflectivity; rub the surface uniformly with a rough cloth so that it is well scratched; measure again the total reflectivity; grind the surface with µgrit 9; clean carefully and thoroughly (using acid if necessary); measure again the total reflectivity. The three measurements should be very close together although the last item can hardly be called a mirror. Now imagine that the primary mirror of your telescope is in a state close to the third sample, would you believe the total reflectometer, which does not notice that the mirror is not a mirror anymore but a nearly perfect diffuser?
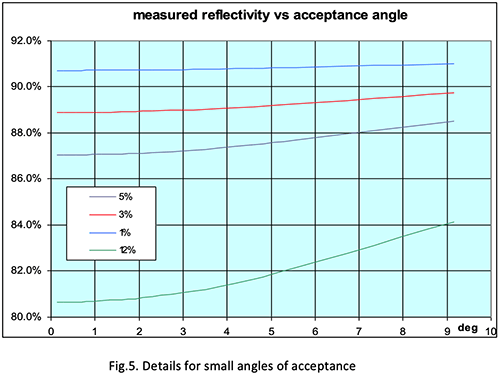
This is illustrated in the following two figures. Fig. 4. plots the reflectivity measured vs. the acceptance angle of the apparatus for four mirrors in various states of exposure (from very clean 1% scattering to very dirty 12% scattering).
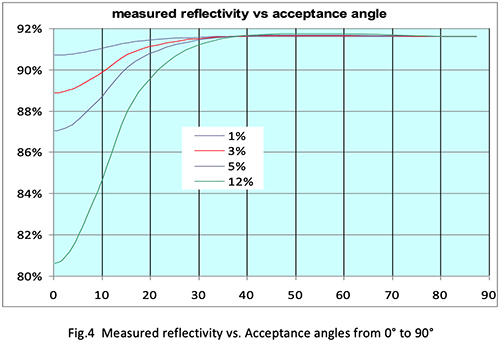
Specular reflectivity corresponds to a zero-degree acceptance (strictly speaking this should be the resolving angle of the telescope; this is of the order of 1”). The total reflectivity (or albedo-meter) corresponds to an acceptance angle of 90°. One sees that an albedo-meter will measure the same figure a=91.63%, whatever the state of the mirror. In fact, it measures the absorbing properties of aluminum (k=1-a). The specular reflectivity , on the other hand, varies from 90.7% to 80.6% with aging of the mirror. Measuring the ‘reflectivity’ with a gloss meter like for example the Minolta CM-2002, is done by subtracting the measurement made with the port open from the measurement made with the port shut. This amounts to measuring the reflectivity with an acceptance angle of 8°, and the corresponding systematic error can be read from Fig.4 3. And 4.4 (2% for a dirty mirror; 1.3% for an exposed mirror; 0.8% for a clean mirror).
This analysis is performed assuming a white diffuser; if the dust absorbs some part of the flux on top of scattering it, the albedo will go down when scattering is increasing by that fraction of light, which is absorbed by the dust. Thus the albedo-meter actually measures a mixture of the aluminum absorption property and of the color of the dust contaminating the mirror. But this has nothing to do with the imaging property of the mirror, which is given exactly by the value of the specular reflectivity .
Conclusion
From this analysis one can conclude that the driving characteristic of the quality of telescope coating is its specular reflectivity in an as large as possible spectral domain. Specular reflectivity means the reflectivity measured in an acceptance angle < 1.5° if the mirror is allowed to degrade up to a TIS of 15% and one still wants to obtain accurate measurements.Measurement of scattered light does not add any useful information because the dust is not important as far as it does not absorb too much of the flux, but the latter situation is completely and accurately covered by the specular measurement. (see the scenario below)
Measurement of scattering just after aluminization in a clean environment makes sense because it shows the µroughness of the coated surface and indicates that the coating process has not deteriorated the polish quality of the mirror. It should of course be complemented by measurement of the specular reflectivity for acceptance of the coating and further reference.
The scattering measurement for appreciating the µroughness should be performed with a scatterometer that works at short wavelength and measures at a minimum angle of less than 1° from the specular direction. In other conditions, the scatterometer will be sensitive essentially to dust, scratches and big local defects that have little influence on the image quality of the mirror (it is much cheaper to aim the beam of a powerful search lamp to the mirror in order to do this job with about the same content of information).
The following table is a scenario illustrating the main stream of this argument :
Suppose you measure the coating just after aluminization (t0), sometime later after exposure(t1), and still later (t2).
The coating is measured each time with three apparatus, respectively a 7 wavelength specular reflectometer for the first three column; a scatterometer working at short or at long wavelength (next three columns); and finally a total reflectivity instrument that we call an albedo-meter working at two wavelengths.
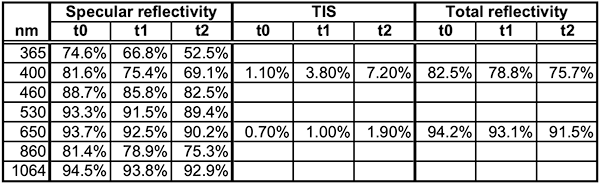
You can see immediately that the data recorded by the 7-color specular reflectometer contains all the information you need in order to monitor the aging of the coating very accurately, while measurements with the albedo-meter contains nearly no useful information. The long wave scatterometer gives a very poor picture of the coating state and misses completely the dramatic degradation of performance at short wavelengths; as a matter of facts, it simply measures the accumulation of dust on the mirror. The scatterometer at short wavelength shows the same but is much more sensitive. Remember however that the short wavelength scatterometer is necessary if you want to assess the quality of a new coating at the opening of the coating tank.
The total reflectivity as measured with an albedo-meter is hardly of any use to assess the aging of the coating, especially if it is limited to long wavelength or ‘white’ light.
Misleading ideas about mirror's coating maintenance
The most remarkable character of the rational truth is that it can be falsified (shown to be wrong) and most of the scientific activity is about trying to show cases where a law does not work.There exists erroneous theories which recommend to measure the total reflectivity or the microroughness of astronomical mirror as the best way to assess the coating. Here we will show why these are erroneous.
Let us try to falsify the following statements:
- In order to measure properly the quality of a mirror’s coating, one should use an instrument that measures the total reflectivity such as given by a Minolta CM508D or a Surface Optics 410-Vis.
- In order to measure properly the quality of a mirror’s coating, one should use an instrument that measures the TIS or the microroughness.
- In order to measure properly the quality of a mirror’s coating, one should use an instrument that measures the specular reflectivity with an acceptance angle not exceeding 1°
Statement #1 is falsified by measuring a mirror that is more and more scratched to the point that it turns to be a finely ground diffuser: the total reflectivity remains more or less unchanged. So that this instrument does not even see that there is no more mirror.
Statement #2 is falsified by measuring a clean uncoated mirror: the TIS would be close to 0.1% and the microroughness close to 1 or 2 nm; however, the reflectivity would be a mere 5%. This technique does not even notice that there is no coating; how would it be the best to assess the quality of a coating?
Hence statement #1 and #2 are definitely wrong because we have found at least one situation where it is clearly false.
What about falsification of statement #3? Try it! Since the specular reflectometer measures the fraction of the incident flux which is reflected in a cone of 1° aperture, it comprises clearly all the light that will form an image since the resolving angle of the telescope is much smaller that 1°. It also includes scattered light within the same angle, but this fraction is less than 0.1% of the useful light at most. Hence the specular reflectometer measures in all cases what needs to be known. In the first falsification case (completely ground mirror) the specular reflectometer will show zero reflectivity and in the second case (uncoated mirror) it will read 5% as it should.
Some would probably argue that measuring the TIS (total scattering not including specular reflection) provides with a good ‘feeling’ of the cleanliness of the mirror. I would answer that a scientist or an engineer cannot do much with feelings; what he needs is significant measurements. Significant is related to the use of the telescope: I would state that the telescope is used to gather as much light as possible from a star into a resolving element as small as possible. This capacity is exactly what specular reflectivity measures. Both other kind of instruments yield wrong or misleading values for this capacity as we have seen.
The last argument would be that the TIS measures what is subtracted from the useful specular flux so that it indicates the loss of quality. Yes, but it gives no idea of the quality. If after coating two mirrors you would measure a specular reflectivity of, say, 94.2% and a TIS of 0.1% for both of them and one month later you measure for the first one 92.8% and 0.5% and for the second one 87.5% and 0.7% what figures are more significant: those from the reflectometer (94.2%; 92.8% and 87.5%) or those of the scatterometer (0.1%; 0.5% and 0.7%)? The second mirror has sustained a massive loss of efficiency because the coating was too thin and has been eaten by exposure to a chemically aggressive atmosphere; the reflectometer sees it and reports exactly what you want to know; since the polish has not been substantially degraded, the scatterometer does not see anything.
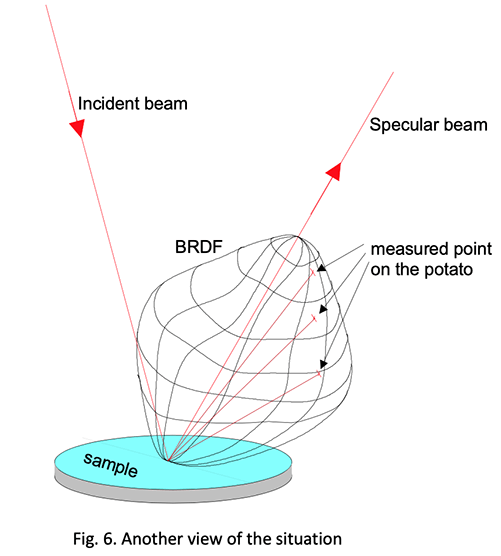
The same explained with a drawing
The reflection on a polished surface can be visualized in the following way. A small parallel beam is incident on the surface with a total power of Pi watts; the specularly reflected beam is reflected following the Snell’s law within a cone of semi aperture of a few airy radius of the total aperture of the telescope (from which the small beam is a part); this cone is always way under 1 arcs for an astronomical telescope. This specular beam contains all the useful light for the astronomer. Its power is Pr and the ration Pr/Pi is the specular reflectivity .Some light is scattered from the incident beam; this light is distributed in a potato like volume around the incidence point (Fig.6.) If the volume is constructed so that for each direction the length of the vector from the incidence point to the surface of the potato is equal to the power scattered per unit solid angle in that direction, the Total Integrated Scattering ( TIS ) is the volume of the potato. So you see the metrology problem:
- In order to measure the specular reflectivity , one just has to intercept the incident beam and the specularly reflected beam with a detector and compute the ratio of the two measurements: simple enough!
- In order to measure the TIS , one has to evaluate the volume of the potato and divide it by the power of the incident beam: difficult enough!
Ideally, one should measure the scattered light in as many directions (in two angle geometry) as needed to reach the required accuracy in estimating the volume of the potato; in practice, this is limited to one to four angles in the plane of incidence. One then extrapolates the measured results for the rest of the potato by making assumptions on its shape. This is a very rough process which can only yield very rough results. More drawbacks compared to specular measurements are to be mentioned:
- The scattered signal (volume of the potato) is much smaller than the specularly reflected signal (of the order of 0.02/2/π/2500 i.e. 10 -6 ).
- This necessitates that the source be a laser (not a Led) and one has to cope with speckles and polarization.
- There is a singular point at the pole with a two-angles measurement.
- For accurate measurements (better than 30%) one should measure the light scattered very close to the specular beam (~1°); this requires a very tiny incident beam (0.3 to 0.5 mm on the sample).
- This very small test area yields unstable results depending on the place of measurement because (except for true microroughness) the scatterers are highly non uniformly distributed on the surface. To be sure, observe a dusty mirror with a small magnification microscope. The test area of a reflectometer is at least 100 times larger than the test area of a scatterometer.
- If the TIS is extrapolated from a single angle, the result can be only an order of magnitude and could exhibit little variations while the true TIS varies by a factor of two or more.
One sees once more that all the data needed to monitor accurately the quality of the coating is given by measuring the specular reflectivity and not the scattering or, even worse, the total reflectivity. If you ask the question; how do I know if flush cleaning has any chance of success when I do not measure scattering? I would say: use a search light to see the dust on your mirror, it is far cheaper than a scatterometer. If then you cry that this is no measurement, I will advise the following procedure: Spot a small area of the mirror at hand; measure its reflectivity with the specular reflectometer ; flush this area; remeasure the same area; compare the measurements before and after flushing. You will know exactly what you are doing; much better than with a scatterometer that will indicate you microroughness figures that nobody can interpret in term of quality or cleanliness of the coating.
The last but not least advantage of the specular reflectometer is of course that it can measure simultaneously in several wave bands covering the entire useful spectrum.
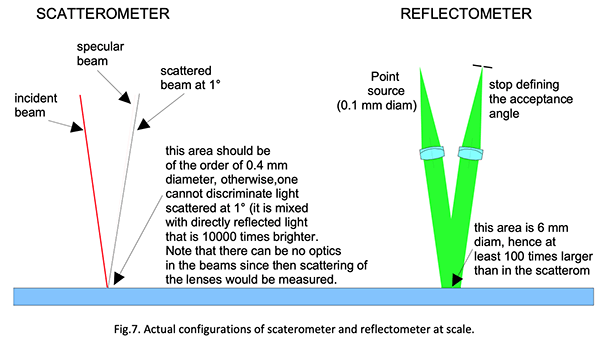
This figure shows clearly why the test area is much larger for the reflectometer than it is for the scatterometer. This was not apparent in the previous illustrations because, as usual in optics, beams are represented by rays and their extension cannot be figured by no professionals.
There is one situation where a large field scatterometer can be useful for the user of a telescope. We have seen that dust in reasonable amount does not impair the reflectivity, nor the resolving power of the telescope; if dust is present in ‘non reasonable’ amount, it is detected by the loss of reflectivity. But in the case of observing a faint object while a very bright object (like the Moon) or many medium bright objects (if the observation field is in the milky way) the addition of scattering contributions might compete with the light of the observed object. This is the case when trying to observe directly a planet satellite of a star outside the solar system. Those very sensitive observations should be conducted soon after realuminization. Monitoring of the dust contamination should be performed for this limited purpose, using an integrating scatterometer, that is an instrument that integrates the scattered light from a large cone of acceptance such as the albedo meters or the dust index function of the CT7 . In both cases the test area is large compared to a laser instrument and does not need repeated measurements to obtain a stable result.
Instrument principle
Small acceptance angle apparatus
Fig. 8. shows the principle of limiting the acceptance angle of a reflectometer. The solid angle accepted by the detector is limited by a stop. Shown is a stop with 1° half angle as a plain line, and a stop with 5° half angle as a dotted line. In green the irradiance profile (increasing downwards); the round shaped part is the scattered light, while the narrow peak is the specular beam. Remember that this is a logarithmic scale. One sees that the 5° stop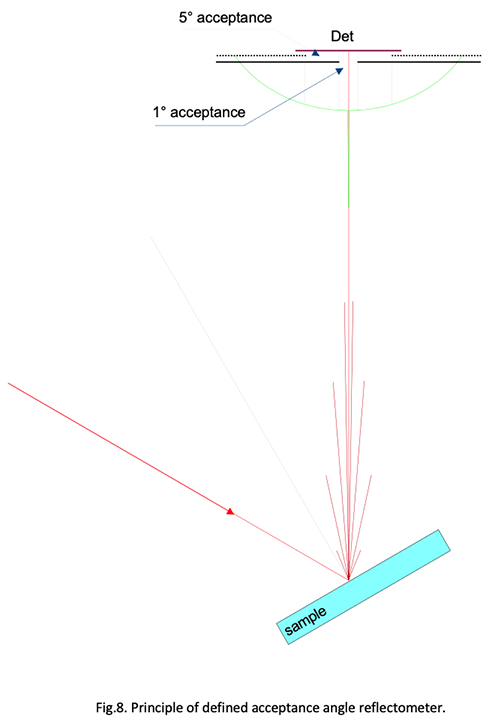
adds more scattered light to the measured value than the 1° acceptance stop. This ratio could go to as high values as 25 for a nearly lambertian diffuser. Hence, it is particularly awesome to measure with a large acceptance angle dusty mirrors that show a rather flat scattering function.
In the real apparatus, the incident beam is close to parallel and quite large; the reflected beam is imaged onto the stop by a lens. The acceptance angle is then the arctg of the stop radius divided by the focal length of the lens.
Total reflectivity apparatus (albedo-meter)
There are several arrangements for measuring the total reflectivity or albedo of a sample; all include an integrating sphere. This is a hollow sphere with a white lambertian coating inside. It has the remarkable property that if you lit one point of the inside sphere, the whole surface is uniformly and isotopically irradiated. This is strictly true for a complete sphere, but remains fairly the case if ports are opened in the sphere as long as their total area remains very small compared to the area of the sphere. These ports are necessary to introduce a flux of light into the sphere, to submit a sample to the surface irradiance, and to extract some beam for the measurement.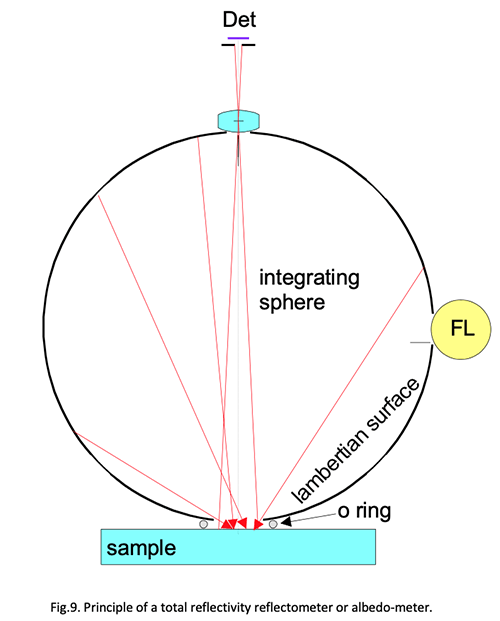
One common arrangement is illustrated in Fig.9.; The source of light in this example is a flash light (FL) through a port to the right of the figure (but it could be any kind of source). The sample is presented at a second port at the bottom of the sphere. Some internal screens prevent direct light from the source to hit the sample. The measuring beam is extracted through a third port at the top of the sphere, where a lens images a stop onto the central part of the sample. Since the sample is irradiated equally from all directions, the measured reflectivity is the total reflectivity with an acceptance angle close to 90°. Note that one could also revert the arrangement and lit the sample with a parallel beam through the top port and measure the sphere irradiance through the port on the right, avoiding direct view of the sample. The two arrangements are strictly equivalent. Both measure the albedo of the sample and are of practically no use in measuring the quality of mirror’s coating.
The CT7 apparatus
This instrument is the outcome of 50-year experience in optical metrology. I am a retired astronomer and I do not need building and selling instruments, but I care very much providing astronomers, my fellows, with quality control instruments that match the quality of modern telescopes.History
The first Iris was built 35 years ago (1996) for checking the quality of car windshields in Sweden. It was originally a scatterometer. Winters are hard up there and they use nailed tires so that at the end of winter, most windshields are like sand blasted. The governmental road security organization asked me to develop a handy instrument for checking the quality of windshield in the field. Soon, a reflectometer was added to the same instrument and it became quite sophisticated, including four wave bands as it was provided to major observatories. Today, this instrument looks to me like a dinosaur; with my accumulated experience and the many discussions I had with astronomers, I am able today to propose what I think is the best up to date instrument for observatories. The electronic is based on a TI DSP board and will be up to date for years. Light sources are SM LED’s associated with fiber optics; LED’s can be easily upgraded if new wave bands are asked.Specifications
The CT7 is a new instrument specially thought for accurate long-term assessment of telescope's mirror coatings.It has an acceptance angle of 1.5° (half angle) and works at 8° incidence.
The 7 Bands can be chosen in the UV-Visible-NIR region; current choice is the following:
| Wavelength (nm) | Bandpass (nm) |
|---|---|
| 365 | 10 |
| 411 | 15 |
| 528 | 30 |
| 630 | 30 |
| 750 | 50 |
| 850 | 50 |
| 940 | 40 |
The sources are modulated at a frequency around 1Khz and detected by the technique of digital lock in amplifier based on a DSP board.
Two identical detectors are used; one to measure the reference signal of the source, the other to measure the reflected signal. Both signals are digitally detected and the ratio of the source signal to the reference signal is recorded and processed to yield the reflectivity value. Each color is lit and measured sequentially for one second.
The two detectors are mounted on the same heath sink. This insures a long-term absolute stability and immunity against temperature variations even when the sources degrade or vary in intensity. This instrument is factory calibrated and delivered with a calibration gauge. Only dirt or pollution on internal optical elements could change the response and necessitate recalibration.
Global absolute accuracy : 0.2% for R > 50%
Repeatability: 0.01% for R > 50%
The apparatus is small (88 mm x 65 mm x 130 mm high) and light (<650 gr) and in one piece (no wire; one hand operation).
It is positioned by a three point soft contact.
Internal memory keeps more than 200 measurements including date, time and temperature, sequential number and individual identification. Battery last for more than 300 measurements.
Talking with the apparatus via PC and USB2 connection.
Batteries are charged while connected to the USB port of the PC.
Copyright:
Author:
Daniel Malaise, Dr Sc
First issue: October 2009
Last review: August 2020
This document is the sole property of OPO and, except to learn about our work, may not be used without our written consent.